Firelight is a visualization library for pytorch.
Its core object is a visualizer, which can be called passing some states (such as inputs, target,
prediction) returning a visualization of the data. What exactly that visualization shows, is specified in a yaml
configuration file.
Why you will like firelight initially:
- Neat image grids, lining up inputs, targets and predictions,
- Colorful images: Automatic scaling for RGB, matplotlib colormaps for grayscale data, randomly colored label images,
- Many available visualizers.
Why you will keep using firelight:
- Everything in one config file,
- Easily write your own visualizers,
- Generality in dimensions: All visualizers usable with data of arbitrary dimension.
On python 3.6+:
# Clone the repository
git clone https://github.com/inferno-pytorch/firelight
cd firelight/
# Install
python setup.py installFirelight is available on conda-forge for python > 3.6 and all operating systems:
conda install -c pytorch -c conda-forge firelightIn an environment with scikit-learn installed:
pip install firelight- Run the example
firelight/examples/example_data.py
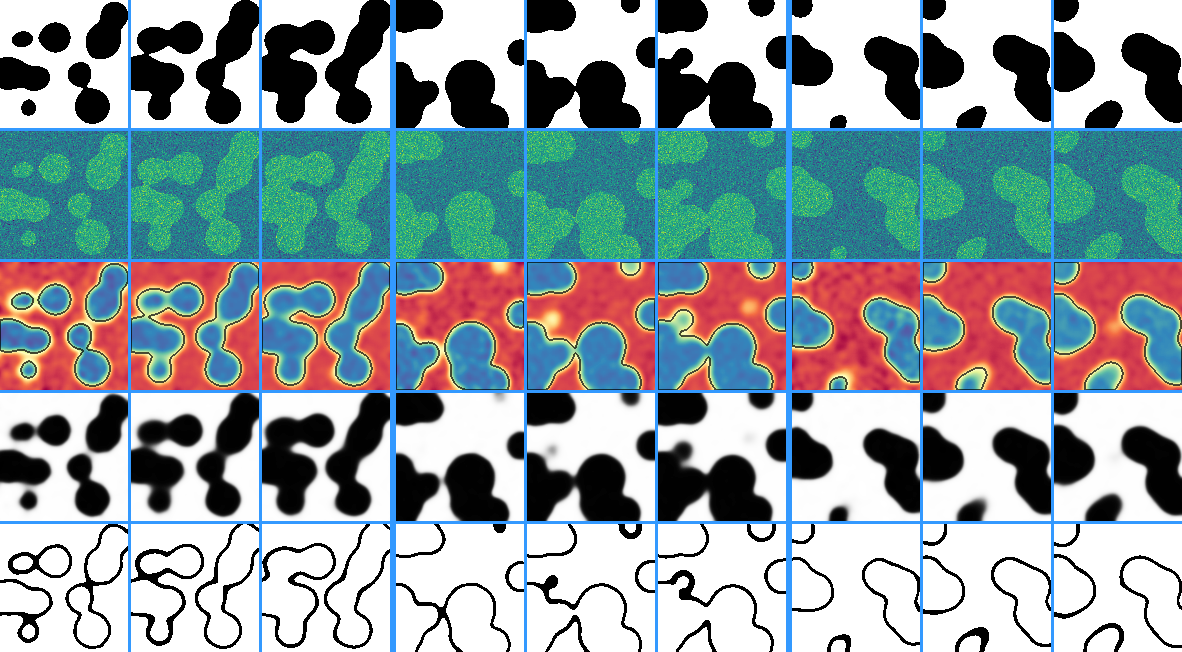
Config file example_config_0.yml:
RowVisualizer: # stack the outputs of child visualizers as rows of an image grid
  input_mapping:
    global: [B: ':3', D: '0:9:3'] # Show only 3 samples in each batch ('B'), and some slices along depth ('D').
    prediction: [C: '0']  # Show only the first channel of the prediction

  pad_value: [0.2, 0.6, 1.0] # RGB color of separating lines
  pad_width: {B: 6, H: 0, W: 0, rest: 3} # Padding for batch ('B'), height ('H'), width ('W') and other dimensions.

  visualizers:
    # First row: Ground truth
    - IdentityVisualizer:
        input: 'target' # show the target

    # Second row: Raw input
    - IdentityVisualizer:
        input: ['input', C: '0'] # Show the first channel ('C') of the input.
        cmap: viridis  # Name of a matplotlib colormap.

    # Third row: Prediction with segmentation boarders on top.
    - OverlayVisualizer:
        visualizers:
          - CrackedEdgeVisualizer: # Show borders of target segmentation
              input: 'target'
              width: 2
              opacity: 0.7 # Make output only partially opaque.
          - IdentityVisualizer: # prediction
              input: 'prediction'
              cmap: Spectral

    # Fourth row: Foreground probability, calculated by sigmoid on prediction
    - IdentityVisualizer:
        input_mapping: # the input to the visualizer can also be specified as a dict under the key 'input mapping'.
          tensor: ['prediction', pre: 'sigmoid'] # Apply sigmoid function from torch.nn.functional before visualize.
        value_range: [0, 1] # Scale such that 0 is white and 1 is black. If not specified, whole range is used.

    # Fifth row: Visualize where norm of prediction is smaller than 2
    - ThresholdVisualizer:
        input_mapping:
          tensor:
            NormVisualizer: # Use the output of NormVisualizer as the input to ThresholdVisualizer
              input: 'prediction'
              colorize: False
        threshold: 2
        mode: 'smaller'
Python code:
from firelight import get_visualizer
import matplotlib.pyplot as plt

# Load the visualizer, passing the path to the config file. This happens only once, at the start of training.
visualizer = get_visualizer('./configs/example_config_0.yml')

# Get an example state dictionary, containing the input, target, prediction
states = get_example_states()

# Call the visualizer
image_grid = visualizer(**states)

# Log your image however you want
plt.imsave('visualizations/example_visualization.jpg', image_grid.numpy())
Resulting visualization:
Many more visualizers are available. Have a look at visualizers.py and container_visualizers.py or, for a more condensed list, the imports in config_parsing.py.
Firelight can be easily combined with a TensorboardLogger from inferno.
Simply add an extra line at the start of your config specifying under which tag the visualizations should be logged, and
add a callback to your trainer with get_visualization_callback in firelight/inferno_callback.py
Config:
fancy_visualization: # This will be the tag in tensorboard
    RowVisualizer:
      ...
Python:
from inferno.trainers.basic import Trainer
from inferno.trainers.callbacks.logging.tensorboard import TensorboardLogger
from firelight.inferno_callback import get_visualization_callback

# Build trainer and logger
trainer = Trainer(...)
logger = TensorboardLogger(...)
trainer.build_logger(logger, log_directory='path/to/logdir')

# Register the visualization callback
trainer.register_callback(
        get_visualization_callback(
            config='path/to/visualization/config'
        )
    )
